Portfolio Details
Jewelry Spreadsheet
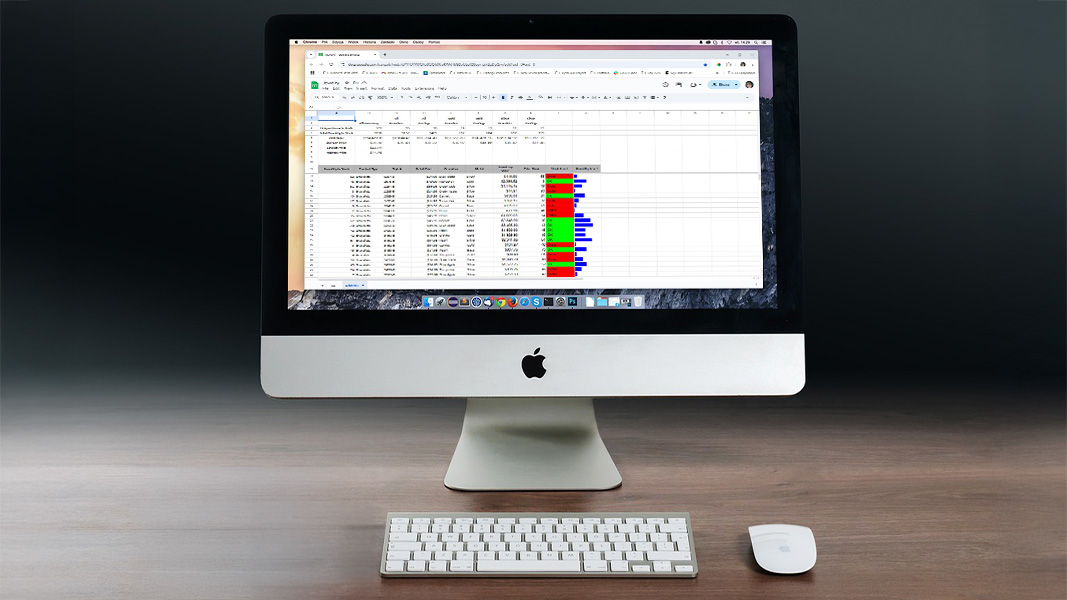
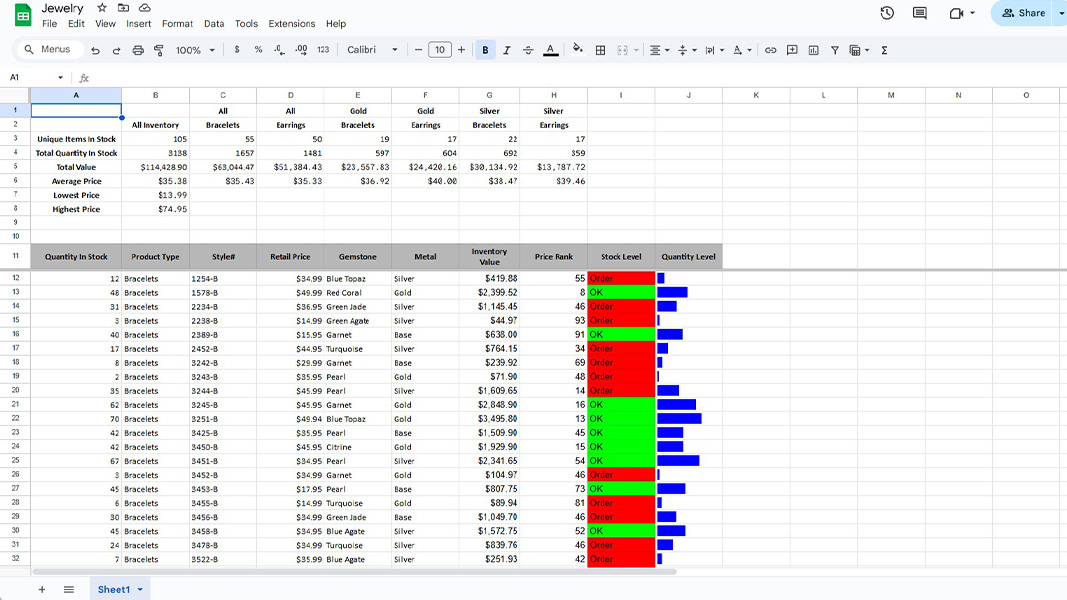
For this assignment, I worked with a set of jewelry data in Google Sheets, applying a range of functions to analyze and calculate various metrics related to the inventory. The task involved importing a CSV file containing jewelry stock information and performing calculations such as the number of unique items in stock, the total quantity, and the total value using functions like COUNT, COUNTIF, SUM, SUMIF, and others. I formatted the sheet to make it clear and easy to read, including adding headings and ensuring the correct calculation for each data point using the appropriate formulas. This assignment helped me further understand how to apply Google Sheets functions for more complex data analysis and automate calculations based on dynamic data.
In addition to basic functions, I also used advanced formulas such as AVERAGEIFS and MIN/MAX functions to derive insights into the jewelry stock, including the average price and identifying the lowest and highest retail prices. I also used the RANK function to assess the rank of the prices in the inventory, allowing me to compare values effectively. The exercise not only reinforced my skills in using Google Sheets functions but also provided a practical application for managing and analyzing business inventory data. The hands-on nature of this project enhanced my ability to organize and process large sets of data while ensuring accuracy and efficiency in calculations.
Project Information
- Category Database
- Client Bruce Bauer - UALR
- Project date 4 October, 2023
- Final Grade A
- Visit Spreadsheet


